Good morning, Mission, and welcome to Virus Village, your (somewhat regular) Covid-19 data dump.
Infection numbers, hospitalizations and positivity rates have been slightly rising over the past week, while R Number models show today a slight decrease in the rate of transmission.
Yesterday’s Grand Rounds featured a discussion on the evolution of the virus and what we can expect from rapid tests. The Biden administration yesterday announced new funding for more at-home rapid tests. I wish they had addressed the virus’ unusual pattern in San Francisco that has persisted for the last three weeks.
Despite the numbers, the big news today is that San Francisco will be loosening its indoor masking requirements next week. Though it may be difficult to understand which places will not require a mask, this is how the Mayor explains it. For the foreseeable future masks will still be required in restaurants and bars (where I have observed very few people follow the rules to mask up between bites and sips).
It may also be difficult to understand why the City is changing its policy. The criteria for loosening the mask requirements are: 1. moderate transmission as determined by the U.S. Centers for Disease Control; 2. 80 percent of the total population fully vaccinated; and 3. hospitalizations low and stable. According to the latest data, SF misses on the first two, and the third is a judgement call.
Is the immunity offered by natural infection the same as the immunity you get from The Vaccine? Although infection is thought to confer a certain amount of immunity, no one is quite sure how much immunity, or how long it will last. Since no company profits off natural immunity, few studies have been done on the subject, but here’s one published recently, concluding “[t]he protective effect of prior SARS-CoV-2 infection on re-infection is high and similar to the protective effect of vaccination,” but that more research on duration of protection and protection against variants is needed.
A new study out of Italy shows that, seven months after the second dose, there is no reduction in the efficacy of COVID-19 mRNA vaccines in the general population, while a slight decline is seen for some specific groups. However, recent data suggests an mRna booster for those who received the Johnson & Johnson vaccine. According to University of California, San Francisco doctor Monica Gandhi, UCSF is already providing a booster “to anyone who had gotten Johnson & Johnson vaccines.”
Positivity rates are based on testing, but not all tests (like at-home rapid tests) are counted. While the number of tests counted by the City is down from last winter, far more tests have been collected than last spring and summer.
Covid-related deaths in San Francisco are always difficult to figure. DPH added 5 more deaths in September, bringing the Delta total (August and September) to 68 so far, and the cumulative covid-related death toll to 644. According to DPH, over half the deaths were among persons over the age of 80 with nearly all are over the age of 60. Less than 3 percent had no known underlying condition. DPH has stopped reporting the vaccination status of covid-related deaths.
After showing San Francisco above 1, Covid R Estimation lowered its most recent San Francisco R Number back to .96. It raised its current estimate for the California R number to .92. The ensemble also lowered its average San Francisco R Number to .85 while maintaining its California average at .84. Only one model in the ensemble shows the SF rate of transmission above 1.
As of October 1, DPH cites data from the SF Unified School District asserting 353 covid infectons out of nearly 52,000 students and nearly 10,000 staff in public schools. In private, parochial and charter schools, there were 127 cases out of nearly 22,500 students and nearly 5,000 staff. DPH also says “The vast majority of these infections are occurring outside of schools” citing only 18 “suspected in-school transmissions”.
As of September 30, Whites have had 1,060 new cases in the month, Asians 647, Latinxs 551, Blacks 213, Multi-racials 51, Pacific Islanders 35 and Native Americans 9 new cases.
Positivity rates are based on testing, but not all tests (like at-home rapid tests) are counted. While the number of tests counted by the City is down from last winter, far more tests have been collected than last spring and summer.
Covid-related deaths in San Francisco are always difficult to figure. DPH added 5 more deaths in September, bringing the Delta total (August and September) to 68 so far, and the cumulative covid-related death toll to 644. According to DPH, over half the deaths were among persons over the age of 80 with nearly all are over the age of 60. Less than 3 percent had no known underlying condition. DPH has stopped reporting the vaccination status of covid-related deaths.
After showing San Francisco above 1, Covid R Estimation lowered its most recent San Francisco R Number back to .96. It raised its current estimate for the California R number to .92. The ensemble also lowered its average San Francisco R Number to .85 while maintaining its California average at .84. Only one model in the ensemble shows the SF rate of transmission above 1.
As of October 1, DPH cites data from the SF Unified School District asserting 353 covid infectons out of nearly 52,000 students and nearly 10,000 staff in public schools. In private, parochial and charter schools, there were 127 cases out of nearly 22,500 students and nearly 5,000 staff. DPH also says “The vast majority of these infections are occurring outside of schools” citing only 18 “suspected in-school transmissions”.
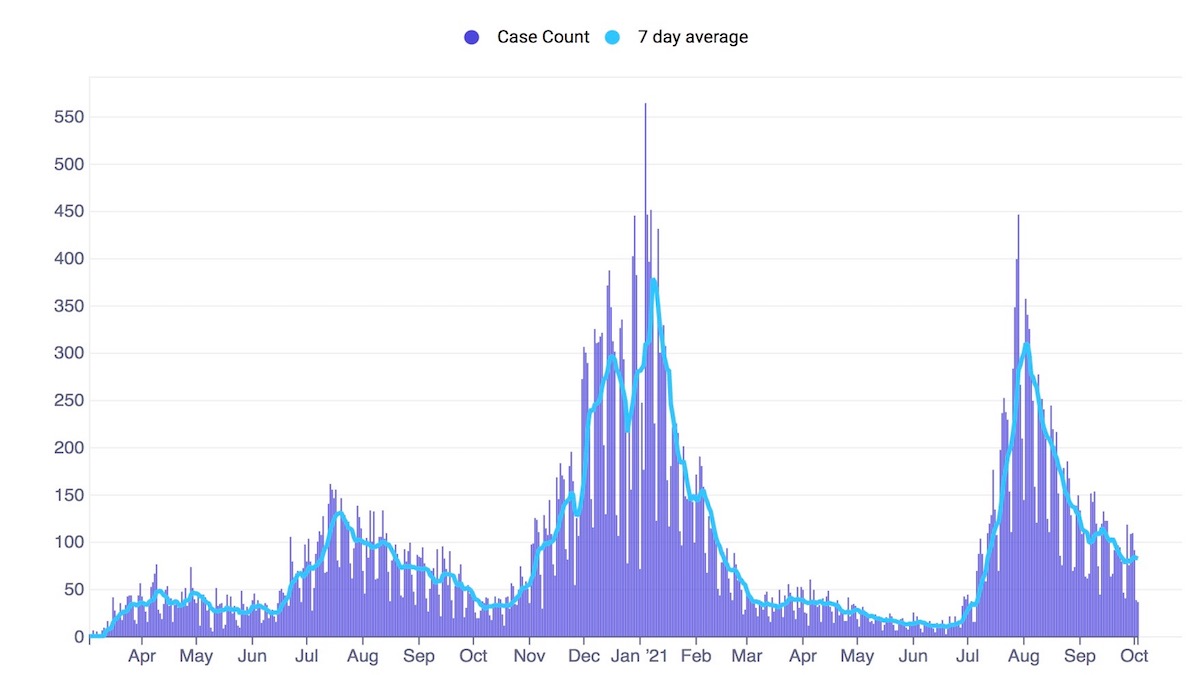
DPH reports for the week ending Sept. 30, the seven-day rolling average of daily new cases in the city rose to 82, or approximately 9.4 new cases per day per 100,000 residents (based on an 874,000 population). The 7-day average case rate among vaccinated residents was 7.8 per 100,000 fully vaccinated residents and for unvaccinated residents 15.1 per unvaccinated 100,000 residents. The CDC, using slightly different numbers, rates community transmission in the City as “substantial“.
As of September 30, Whites have had 1,060 new cases in the month, Asians 647, Latinxs 551, Blacks 213, Multi-racials 51, Pacific Islanders 35 and Native Americans 9 new cases.
Positivity rates are based on testing, but not all tests (like at-home rapid tests) are counted. While the number of tests counted by the City is down from last winter, far more tests have been collected than last spring and summer.
Covid-related deaths in San Francisco are always difficult to figure. DPH added 5 more deaths in September, bringing the Delta total (August and September) to 68 so far, and the cumulative covid-related death toll to 644. According to DPH, over half the deaths were among persons over the age of 80 with nearly all are over the age of 60. Less than 3 percent had no known underlying condition. DPH has stopped reporting the vaccination status of covid-related deaths.
After showing San Francisco above 1, Covid R Estimation lowered its most recent San Francisco R Number back to .96. It raised its current estimate for the California R number to .92. The ensemble also lowered its average San Francisco R Number to .85 while maintaining its California average at .84. Only one model in the ensemble shows the SF rate of transmission above 1.
As of October 1, DPH cites data from the SF Unified School District asserting 353 covid infectons out of nearly 52,000 students and nearly 10,000 staff in public schools. In private, parochial and charter schools, there were 127 cases out of nearly 22,500 students and nearly 5,000 staff. DPH also says “The vast majority of these infections are occurring outside of schools” citing only 18 “suspected in-school transmissions”.
Between Aug. 4 and Oct. 3, DPH recorded 561 new cases in the Mission for a rate of 95newcases per 10,000 residents. Over that period, DPH recorded 690 new cases in Bayview Hunters Point or 182 new cases per 10,000 residents. In Seacliff, there were 17 new cases among 2,507 residents.
DPH reports for the week ending Sept. 30, the seven-day rolling average of daily new cases in the city rose to 82, or approximately 9.4 new cases per day per 100,000 residents (based on an 874,000 population). The 7-day average case rate among vaccinated residents was 7.8 per 100,000 fully vaccinated residents and for unvaccinated residents 15.1 per unvaccinated 100,000 residents. The CDC, using slightly different numbers, rates community transmission in the City as “substantial“.
As of September 30, Whites have had 1,060 new cases in the month, Asians 647, Latinxs 551, Blacks 213, Multi-racials 51, Pacific Islanders 35 and Native Americans 9 new cases.
Positivity rates are based on testing, but not all tests (like at-home rapid tests) are counted. While the number of tests counted by the City is down from last winter, far more tests have been collected than last spring and summer.
Covid-related deaths in San Francisco are always difficult to figure. DPH added 5 more deaths in September, bringing the Delta total (August and September) to 68 so far, and the cumulative covid-related death toll to 644. According to DPH, over half the deaths were among persons over the age of 80 with nearly all are over the age of 60. Less than 3 percent had no known underlying condition. DPH has stopped reporting the vaccination status of covid-related deaths.
After showing San Francisco above 1, Covid R Estimation lowered its most recent San Francisco R Number back to .96. It raised its current estimate for the California R number to .92. The ensemble also lowered its average San Francisco R Number to .85 while maintaining its California average at .84. Only one model in the ensemble shows the SF rate of transmission above 1.
As of October 1, DPH cites data from the SF Unified School District asserting 353 covid infectons out of nearly 52,000 students and nearly 10,000 staff in public schools. In private, parochial and charter schools, there were 127 cases out of nearly 22,500 students and nearly 5,000 staff. DPH also says “The vast majority of these infections are occurring outside of schools” citing only 18 “suspected in-school transmissions”.
The latest report from the federal Department of Health and Human Services shows Zuckerberg San Francisco General Hospital with 8 covid patients and 9 ICU beds available, while across the Mission, CPMC had 4 covid patients and 4 ICU beds available. Of 72 reported covid patients, 40 were at either SFGH or UCSF, and at least 71 ICU beds available among reporting hospitals. The California DPH says there are 83 ICU beds available in San Francisco. The SF DPH won’t say.
Between Aug. 4 and Oct. 3, DPH recorded 561 new cases in the Mission for a rate of 95newcases per 10,000 residents. Over that period, DPH recorded 690 new cases in Bayview Hunters Point or 182 new cases per 10,000 residents. In Seacliff, there were 17 new cases among 2,507 residents.
DPH reports for the week ending Sept. 30, the seven-day rolling average of daily new cases in the city rose to 82, or approximately 9.4 new cases per day per 100,000 residents (based on an 874,000 population). The 7-day average case rate among vaccinated residents was 7.8 per 100,000 fully vaccinated residents and for unvaccinated residents 15.1 per unvaccinated 100,000 residents. The CDC, using slightly different numbers, rates community transmission in the City as “substantial“.
As of September 30, Whites have had 1,060 new cases in the month, Asians 647, Latinxs 551, Blacks 213, Multi-racials 51, Pacific Islanders 35 and Native Americans 9 new cases.
Positivity rates are based on testing, but not all tests (like at-home rapid tests) are counted. While the number of tests counted by the City is down from last winter, far more tests have been collected than last spring and summer.
Covid-related deaths in San Francisco are always difficult to figure. DPH added 5 more deaths in September, bringing the Delta total (August and September) to 68 so far, and the cumulative covid-related death toll to 644. According to DPH, over half the deaths were among persons over the age of 80 with nearly all are over the age of 60. Less than 3 percent had no known underlying condition. DPH has stopped reporting the vaccination status of covid-related deaths.
After showing San Francisco above 1, Covid R Estimation lowered its most recent San Francisco R Number back to .96. It raised its current estimate for the California R number to .92. The ensemble also lowered its average San Francisco R Number to .85 while maintaining its California average at .84. Only one model in the ensemble shows the SF rate of transmission above 1.
As of October 1, DPH cites data from the SF Unified School District asserting 353 covid infectons out of nearly 52,000 students and nearly 10,000 staff in public schools. In private, parochial and charter schools, there were 127 cases out of nearly 22,500 students and nearly 5,000 staff. DPH also says “The vast majority of these infections are occurring outside of schools” citing only 18 “suspected in-school transmissions”.