In one South San Diego ZIP code, new COVID-19 cases grow two times faster than rest of the county
Confirmed COVID-19 cases in a southern San Diego ZIP code appear to be growing at nearly double the daily rate as the rest of the county, according to a new analysis by the San Diego Union-Tribune.
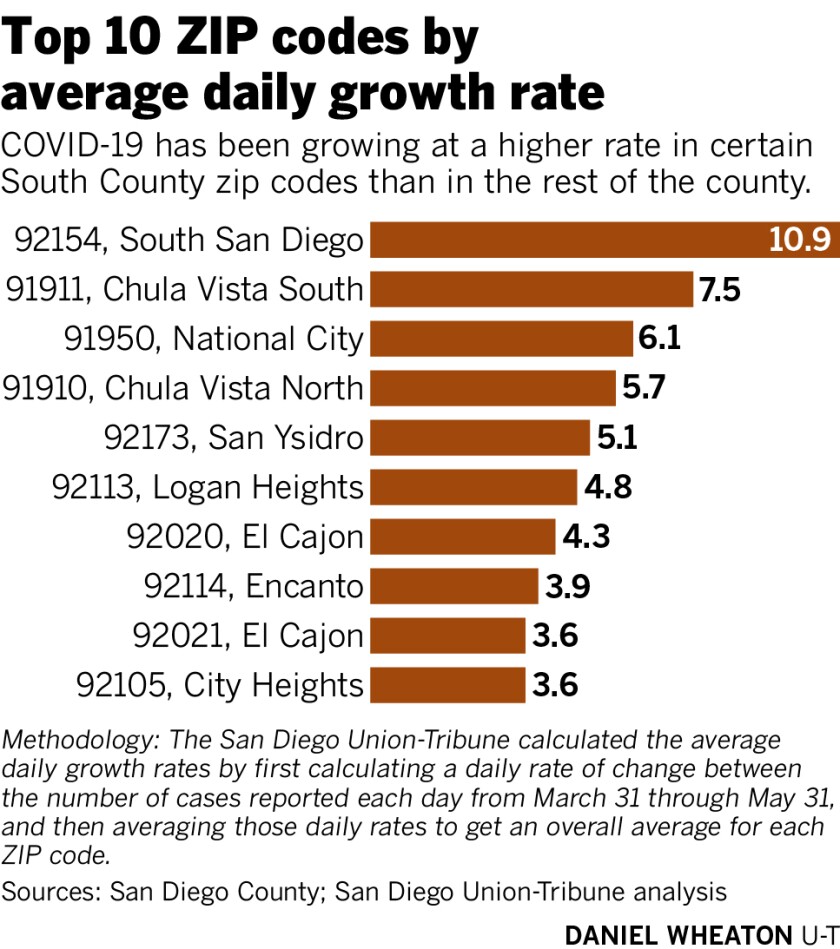
On average there have been nearly 11 new confirmed COVID-19 cases each day in the southern San Diego and Otay Mesa ZIP code 92154, which surrounds San Ysidro and encompasses the area south of Main Street in Chula Vista, down to the U.S.-Mexico border. That is more than in any other area in the county since officials began releasing ZIP code data on March 31.
As of Thursday, the area reported 707 confirmed cases.
South Chula Vista, which has the second highest number of coronavirus cases — some 490 cases as of Thursday — ranks in the No. 2 spot when it comes to the virus’ daily growth rate. Data show the area has added nearly eight new cases every day since the end of March.
The growth rates and total number of cases may be even higher than what’s been reported by the county.
Officials have repeatedly said that ZIP code information is not complete because not everyone is being tested and the totals fail to reflect where an individual was infected.
The number of positive cases could be 10 times greater than what is being reported, county health experts say.
A variety of factors could be contributing to high numbers of cases and growth rates in certain pockets throughout the county, said Jeannette L. Aldous, clinical director of infectious disease for San Ysidro Health.
Those factors include increased testing in certain areas of town, long-standing disparities in access to health care, an over-representation of low-wage essential jobs and a lack of affordable housing.
“We have always had health disparities in our communities; the factors have been known and are not new at all,” Aldous said.
San Ysidro Health, a nonprofit organization, has 80 testing appointments available per day and in the past month averaged 125 tests per week.
Of all the tests conducted so far, Aldous said, 25 percent have been positive, although those numbers are likely high because they are only testing symptomatic patients.
The nonprofit also serves residents who tend to live in households with multiple family members, Aldous said, and they are more likely to work essential jobs, which increases their risk of exposure.
Experts say residents in southern San Diego ZIP codes — including 92154, 91911 in south Chula Vista, and 91950 in National City — are more likely to not have health insurance, compared to residents in other parts of the county.
The data show Hillcrest and Mission Hills ZIP code, 92103, started the pandemic with the highest number of cases in early April. That mirrored a trend seen in more affluent areas throughout California.
According to a Los Angeles Times analysis of county health data in early April, predominantly white and wealthy communities were seeing higher rates of infection than poorer neighborhoods of color.
This did not necessarily mean the virus was spreading faster through rich neighborhoods, experts said. It was more likely that residents in wealthy neighborhoods had better access to testing and were more likely to have traveled internationally before the virus began to proliferate.
In Mission Hills and Hillcrest, data show this might be the case, as its COVID-19 growth rate remained stagnant at about one new case per day from April through May.
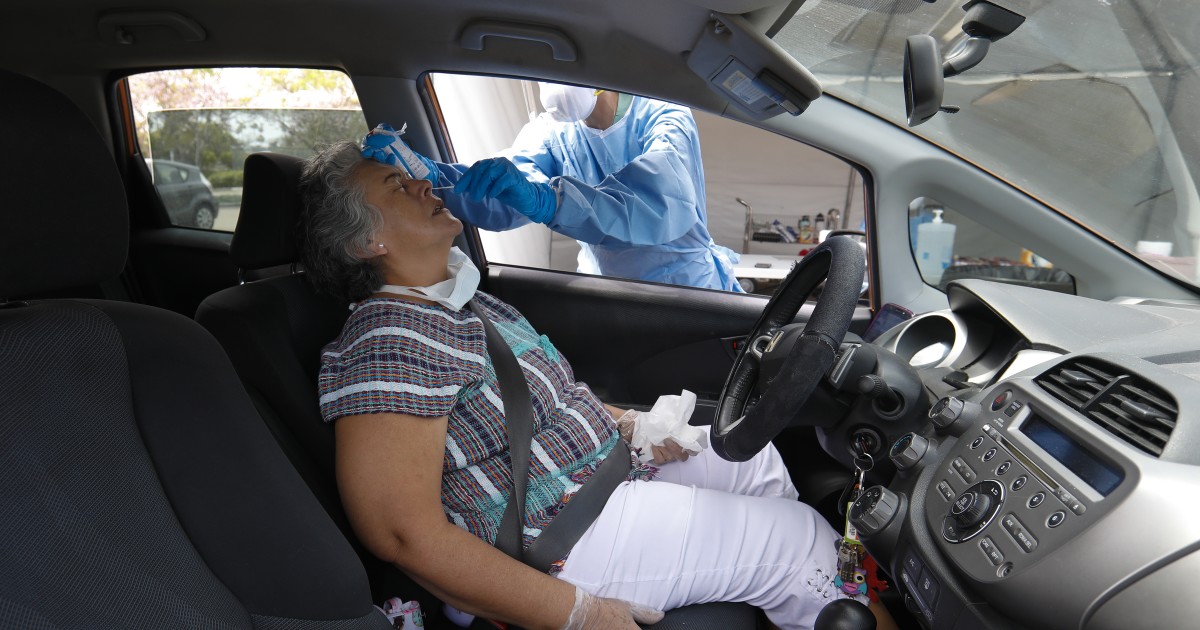
Jeanina Rumbaoa, a registered nurse with County of San Diego Health and Human Services Agency used a smart phone camera to photograph documents afters patients reviewed and signed the document in Chula Vista.
(Nelvin C. Cepeda/The San Diego Union-Tribune)
Meanwhile, the ZIP code representing southern San Diego County has had the highest number of cases in the county since April 13 and has an average daily growth rate that’s nearly 10 times higher.
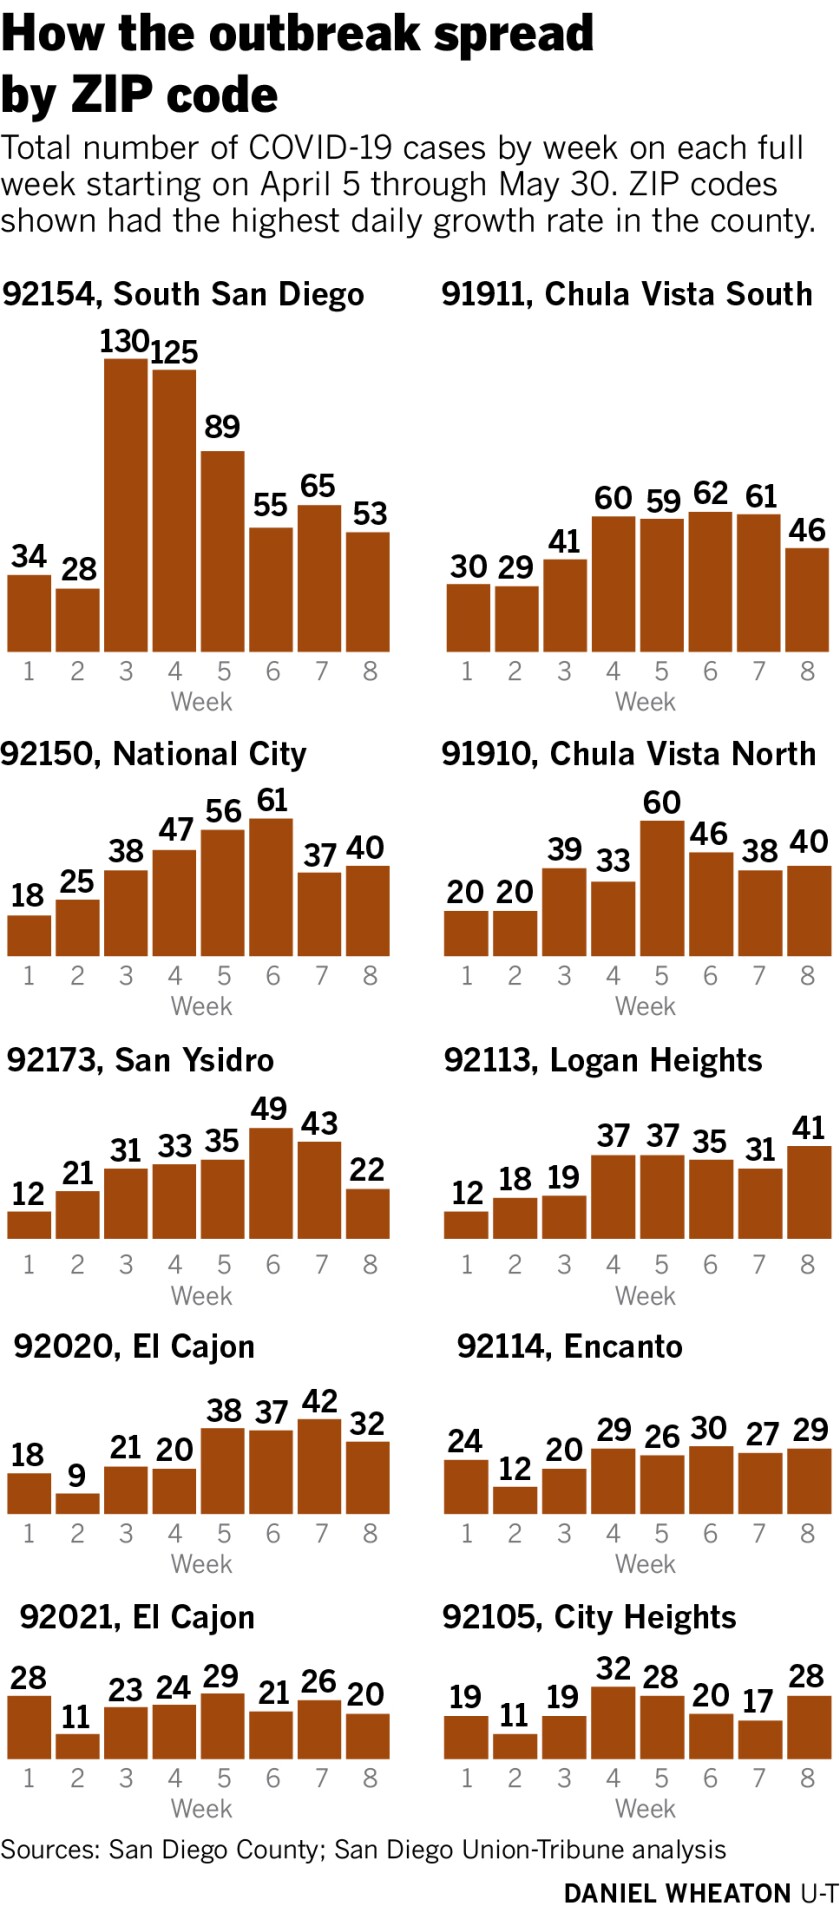
Data show an average of four new cases were recorded in the area by mid-April. The growth rate jumped to 11 new cases each day by the end of the month. In the first two weeks of May, the ZIP code was seeing more than a dozen new cases each day.
Roberto Alcantar, chief strategy officer with social services and advocacy organization Chicano Federation, said the number of positive cases among the immigrant detainees at the Otay Mesa Detention Center could contribute to the rates in the southern San Diego and Otay Mesa ZIP code, 92154. Employees, as well as detainees, have tested positive at the facility.
“We hear anecdotal stories from workers there (who) are saying that it’s chaos; they are worried about their own health and safety,” Alcantar said. “(It has) created a cluster there of people who are potentially transferring this virus to each other in our community.”
The population of Latinos in those ZIP codes could also be a contributing factor, given that Latinos have been hardest hit by the pandemic, experts say. As of Tuesday, Latinos made up 65 percent of positive COVID-19 cases in the county but less than 35 percent of the region’s population.
“The influence of race and ethnicity has been interesting and tragic to track,” said Christian B. Ramers, chief of population health at Family Health Centers of San Diego, pointing to the positive cases among Latinos. “That is really the definition of a health disparity.”
The San Diego Association of Governments, or SANDAG, estimates that more than 66 percent of the 33,100 residents in the 92154 ZIP code were Latino in 2018, the most recent year data is available.
Ramers said movement along the U.S.-Mexico border could also play a role in the high number of cases in southern San Diego, because essential workers in Tijuana travel to San Diego and could be carrying and transmitting the virus.
Tracking workplaces
Alcantar said advocates are pushing county leaders to release more data about positive cases to better understand how the virus is impacting the communities they serve. They say information about employment would help advocacy groups assist essential workers in southern San Diego.
Francisco Martinez, 22, spends the morning with his youngest brother, Cristian Gomez, 4, who is enjoying a video game on his hand held device. The brothers live with their mother, a grocery store worker, and two other brothers in Barrio Logan.
(Nelvin C. Cepeda/The San Diego Union-Tribune)
“If we are not tracking some of the workplace characteristics we are slightly doing ourselves a disservice to find out about community spread,” said Derrick Robinson, senior research and policy analyst with the Center on Policy Initiatives. “Did it start where people live or did it start where people work and spread?”
Advocates also are asking county leaders to pay close attention to cases in southern San Diego as the county moves forward with reopening plans.
“It’s almost like there’s two San Diego counties, the San Diego County north of (Interstate-8) that seems to be doing better … then you have the communities south of the 8 that are still struggling with this crisis,” Alcantar said.
San Diego County has reported numbers cumulatively, meaning the totals represent all confirmed COVID-19 cases in each ZIP code as of the date they are reported, not the total number of new cases each day.
To determine average growth rates, The San Diego Union-Tribune first calculated a change in cases between each day from March 31 through May 31, and then averaged these totals for an overall daily growth rate.


